
Table of contents
What is revenue per visitor?
Revenue per visitor (RPV) is a key metric for retailers and brands and is measured by the amount of revenue (and therefore value) generated by each visitor. This is calculated by the total revenue divided by the total visitor numbers.
RPV is often confused with Average Order Value (AOV).In short, AOV focuses on the average value of each unique conversion whilst RPV measures the average revenue of each website visitor.
Key consideration: visits is not the same as visitors. We would highly recommend that you have two separate RPVs. One which looks at unique visitors and another that looks at total visitors. This will give you much more valuable data to compare, with the former being a more accurate reflection on the revenue per individual visitor.
What is a good RPV rate?
In eCommerce, a “good” Revenue Per Visitor (RPV) rate can vary based on industry benchmarks and business goals. Generally, successful eCommerce stores see an RPV ranging from $0.50 to $5.00, though this figure can be higher for luxury or high-ticket retailers.
Factors influencing RPV include product pricing, conversion rates, and effective customer engagement strategies like upselling. According to a 2024 survey by Forbes, 81% of customers prefer companies that offer a personalized experience, and this personalization can result in significant RPV boosts for companies.
How is RPV calculated?
RPV is calculated by dividing total revenue by visitors over a given time period. This can be measured at any time interval whether this be daily, weekly, monthly, quarterly, yearly or for specific time periods (such as sales periods) where you want to isolate the data for more in-depth analysis.
Revenue Per Visitor (RPV) = Total Revenue / Total Visitors
As mentioned above, we would recommend reporting on two separate metrics: revenue per unique visitor and revenue per all visitors/visits.
For example, if your eCommerce web sales for a given month totalled $50,000 and you had 8,000 unique visitors and 10,000 total visitors, your RPVs would be as follows:
Revenue per unique visitor = $6.25
Revenue per all visitors/visits = $5.00
Key consideration: Be mindful of choosing enough data to be statistically significant and consider whether one-off larger orders may be skewing results.
Why is Revenue Per Visitor (RPV) important?
RPV is a critical key performance indicator (KPI) for eCommerce brands and should be measured alongside other key metrics such as Conversion Rate, AOV, Cost Per Acquisition, and Cart Abandonment Rates (amongst others). For example, a 50% sale on a key product line will likely see your Conversion Rates and Total Order numbers increase but your RPV and margins will see a big dip. Of course, this is not to say “don’t run sales” but these metrics should never be reviewed in isolation as this could lead to incorrect conclusions being made about the company’s performance.
RPV is a key indicator of the long-term health of your brand. Understanding the RPV and how this varies over time helps businesses evaluate the impact of key influences such as:
- The audiences they’re attracting
- The product mix they’re promoting
- The impact of promotions
- How RPV changes as visitor numbers increase and decrease
- How effective the sales funnel is (including cross-sell/up-sell efforts)
- The impact of seasonality
As with other performance metrics, RPV can provide valuable context and insight for eCommerce brands. Understanding how much an average customer spends helps brands shape not only their marketing efforts, such as campaigns, up-sell/cross-sell tactics, but also future product strategy and resources.
For example, if running a discounted offer on a specific product but with the intention of cross-selling other items, does the RPV indicate that customers only purchased that product, or did they add other non-discounted products to basket?
By tracking the Revenue Per Visitor, alongside other key metrics, you have an indicator as to the efficacy of your campaign efforts.
How can you increase your Revenue Per Visitor?
Much like AOV, finding ways to increase your Revenue Per Visitor maximizes the overall ROI of marketing efforts.
We have compiled 6 key strategies designed to improve RPV:
1. Build Consumer Trust with Social Proof:
The last few years has seen a huge upturn in eCommerce activity and accelerated digital transformation.
However, this period also paved the way for less honest retailers to try and capitalize on this shift using “pressure selling” techniques. This in turn has inevitably led to increased shopper distrust towards brands.
This is where Social Proof comes in. On the whole, people trust each other – more than they trust brands. Their purchasing decisions are informed by the actions of others – for example by family and friends, by influencers or by sales assistants.
Social Proof using real-time behavioral data can be added into each step of the buying journey, helping shoppers with both product discovery and make informed purchasing decisions.
Social Proof Messages can include:
- Trending items
- Top-rated or popular items
- Specific reviewer feedback (e.g. size/fit)
- How many items are currently in people’s basket
- Sustainability metrics
- Product Listings Pages
- Product Details Pages
- At Basket
- Social media
- Digital OOH
2. Up-Sell / Cross-Sell Tactics:
Throughout the buying journey, there are opportunities for cross and up-selling including:
Product List Pages:
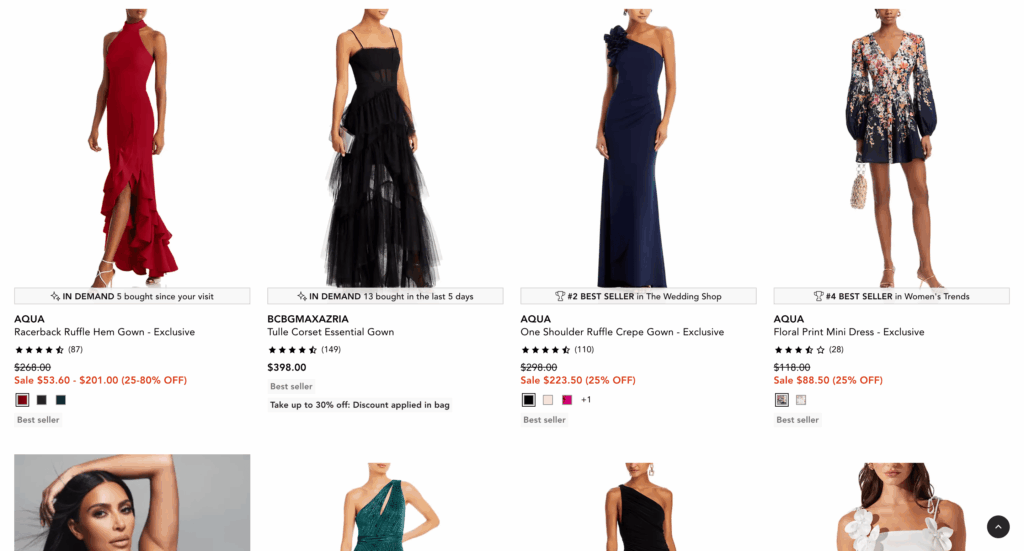
Bestseller badges can be a great tool to nudge shoppers towards higher-value top-selling items within a category

-
Shopping Cart:
-
‘Upgrade’ options can be particularly powerful for travel sectors
-
-
Product Description Page:
-
Suggest add-ons to the item (e.g. personalization, extra features)
-
Fashion retailers often use this as an opportunity to ‘shop the look’ which includes all items in the outfit the model is wearing
-
-
Shopping Basket:
-
Promote products ‘Often bought with’ those in the customer’s basket (e.g. beach kaftan alongside a swimsuit)
-
Adding insurance options for high value items
-
3. Product Bundles:
Bundles can offer attractive offers for customers who are looking for better value (e.g. reduced P&P, discount on buying in bulk) or convenience. Not only can this encourage customers to spend more when they shop, it can also help brands who may have standalone items that are not selling as well.
Here are a few strategies to use bundles to increase RPV:
-
Bundle related items:
For example, this may be a selection of related beauty products which includes lipstick, eyeshadow, mascara and foundation
-
Bundle ‘often bought together’ items:
A common example would be ink cartridges and paper to go with a printer or in the example below it’s a variety of curl control products from Very.com
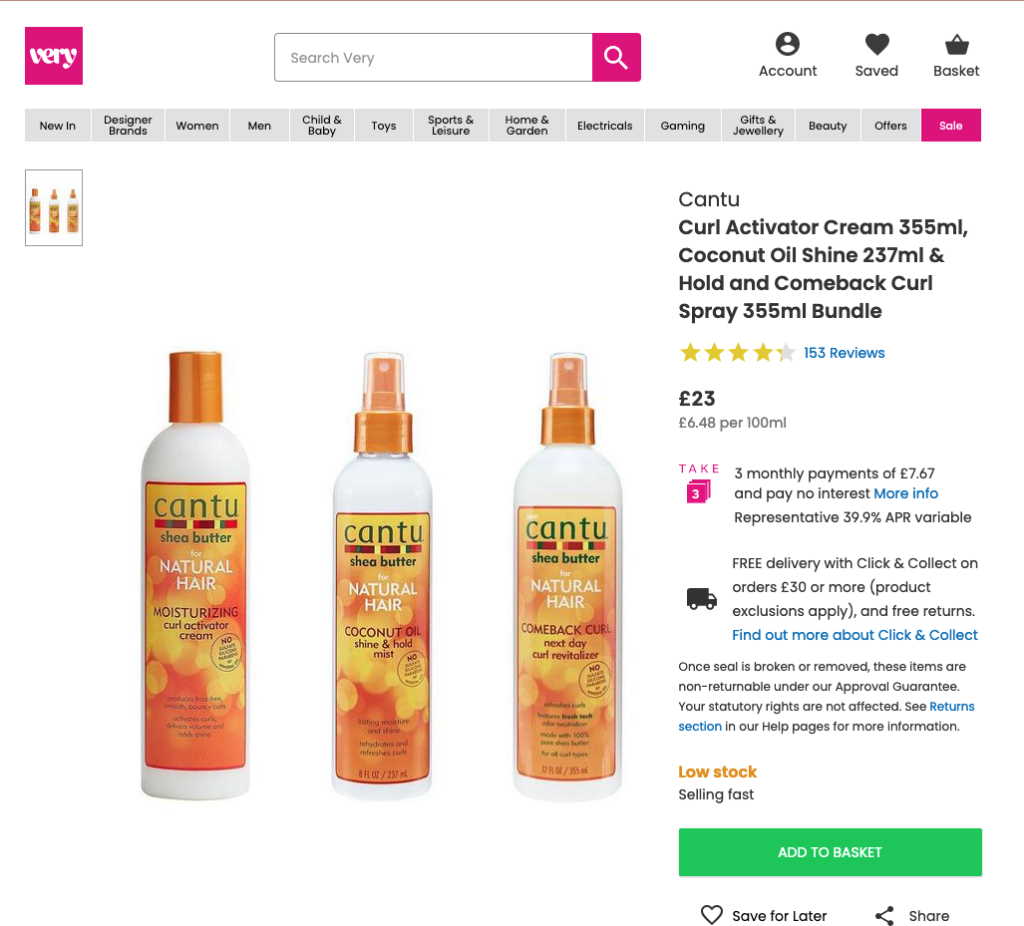
If you’re unsure which products to bundle together, have a look at existing buyer behavior. For example, if someone purchases a shelf, do they also purchase brackets?
4. Conversion Rate Optimization
Conversion Rate Optimization (CRO) refers to the process of increasing the percentage of conversions across your digital platforms (e.g. web, app, social) without needing to increase traffic. By identifying areas that can be optimized in the buyer journey, you can make every visit more valuable.
Improving conversion rates is such a vital part of any eCommerce business that we have dedicated an entire section just on this topic. Head to our Conversion Rate Optimisation page to find valuable strategies to maximize the performance of your eCommerce website.
5. Refine your audience targeting and channel mix
Review key metrics such as Bounce Rate, Pages Per Session, Revenue, Cost Per Acquisition and AOV by channel, audience, campaign and content type. This will give you valuable insights such as channels driving high Bounce Rates which could be an indicator of incorrect targeting, format issues, incorrect messaging or poor creative (or a mixture of all!).
Make sure to reassess any existing campaigns. Are some working better than others? Why? Is it targeting? Messaging? Format? Placement? Identify the poorest performing areas and pause activity. Remember to focus on a mixture of metrics to analyse performance i.e. value as well as volume.
Key Watchout: Often, Paid Social activity can drive high bounce rate visits due to accidental clicking so it is also important to look at other metrics (e.g. Cost Per Acquisition (CPA)) for a holistic view of performance
6. Retarget Audiences
Retargeting is a common way to reach out to customers who have left your site without converting in addition to reaching previous customers with new offers. Types of retargeting campaigns may include:
Discounted / Limited time offers
Related products (people also viewed/purchased)
Alternative products
The same products viewed plus additional related or ‘shop the look’ products (a very common tactic)
There are a multitude of ways to improve your Revenue Per Visit but how do you choose which to focus on?
A useful starting point is to map hypotheses you may have against an Ease Impact Matrix. This will help you identify which hypotheses will be the easiest to undertake and will deliver the largest impact for your business. The ‘ease’ is unique to each organization as it depends on internal structures, technology being used, back-end infrastructure – to name a few.
So, here’s how to increase your business’ RPV
In summary, improving Revenue Per Visitor (RPV) is essential for maximising profits in eCommerce. By implementing strategies like product bundling, social proof, and retargeting, you can boost customer spend and enhance their shopping experience. Start by assessing your current RPV, applying these techniques, and tracking results to continue driving growth.
Ready to see results? Get in touch with Taggstar to learn how our social proof solutions can help elevate your eCommerce performance.