Fashion-forward brand NA-KD was launched in Sweden in 2016. It is primarily an online retailer, taking over affordable and on-trend online fashion and accessories, with on-trend styles. NA-KD is supported by a tribe of international brand ambassadors and content creators, which allows it to update constantly with new content and styles.
The retailer is rapidly expanding, with several new international regional websites due to launch by the end of the year.

3.6% conversion rate uplift using crowd powered product trends to drive online fashion success
Key KPIs delivered by Taggstar
-
-
4
social proof experiments
The Challenge
With its customers at the heart of everything NA-KD’s goal is to provide the best online shopping experience across all channels. A ‘digital native’, NA-KD continues to expand, aiming to deliver a smooth shopping experience with the latest eCommerce optimisation tools.
The Solution
Already a convert to the power of the crowd in retail sales, NA-KD began testing Taggstar in mid-2016. Following a successful test, the company permanently extended social proof messaging to 100% of site traffic from mid-2017.
Social sharing in close collaboration with some of the most sought-after influencers in the fashion industry is core to NA-KD’s relationship with its followers and customers.
The NA-KD web experience is built by making the most of its crowd of influencers and customers. Its merchandising reflects this social vibe, with social follower counts, use of social icons, love heart ‘likes’, social sharing and more, to crowd-source and display shopper feedback.
Using social proof trends aggregated from product likes, sales and add to basket volumes, NA-KD already showcased real-time ‘most wanted’ products on its pages.
The Solution
Using Taggstar allowed it to reflect these crowd-powered trends for every single product as it is viewed, liked and bought.
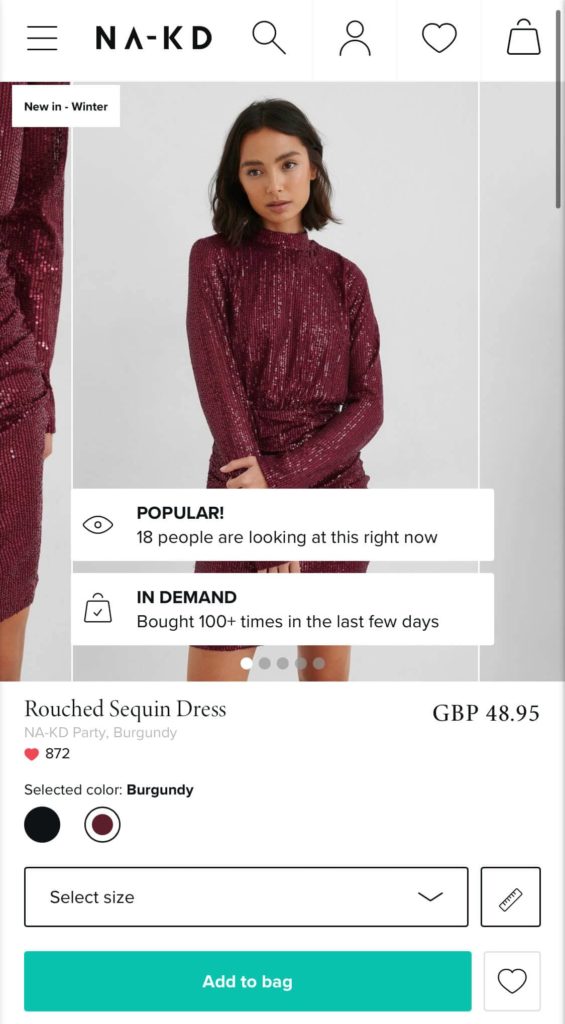
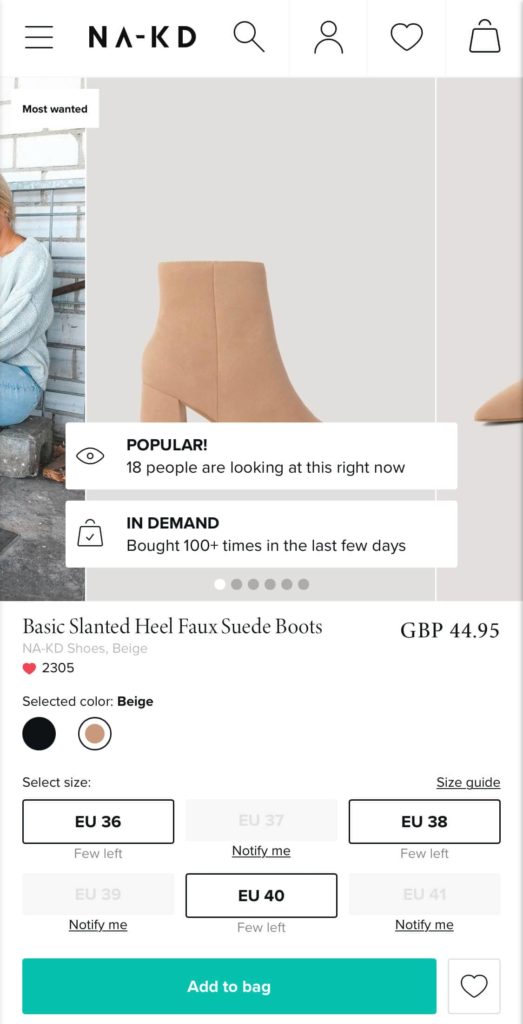
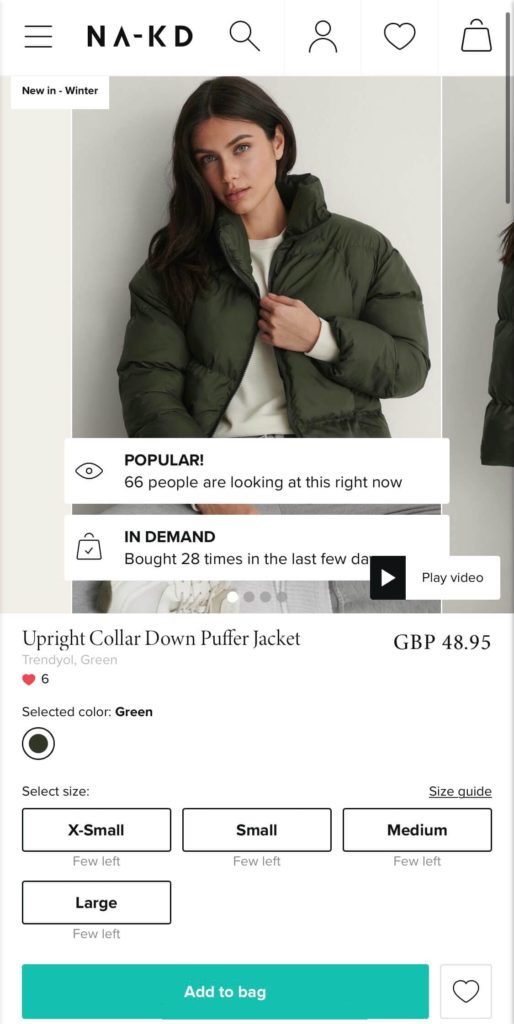
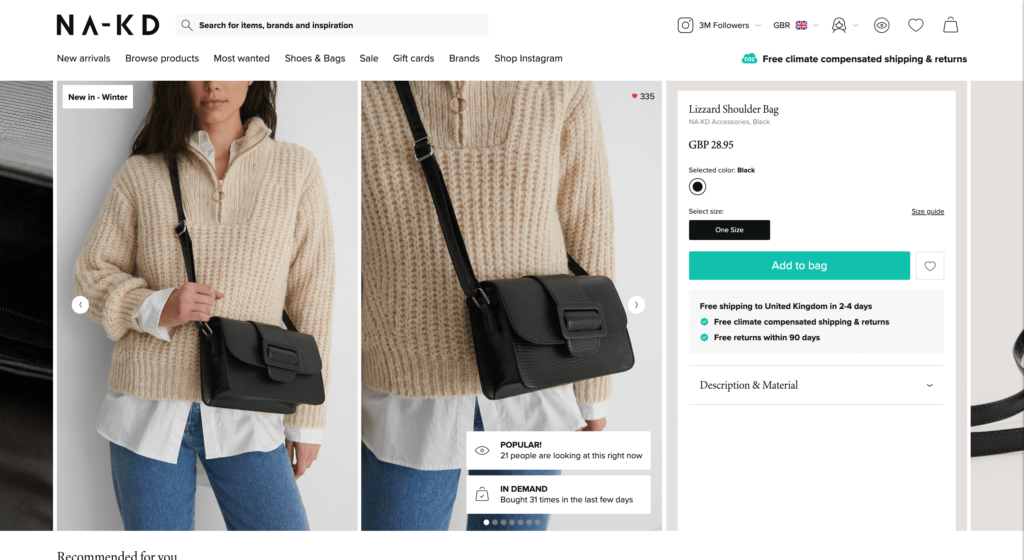
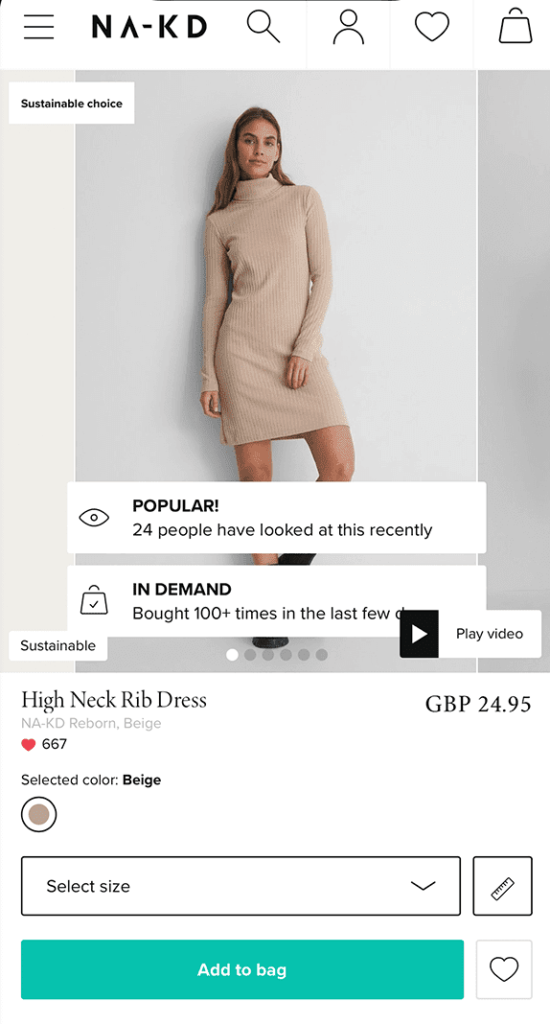
NA-KD uses Taggstar on its product detail pages (PDP). The brand has chosen audience (views) and purchase (sales) counts, trending products, and last purchased (‘bought 30 seconds ago’), to show its customers real-time trends.
Taggstar worked to custom design messaging that matched NA-KD ’s style, and incorporated enterprise social proof best practice. Messages reflect imagery, size, opacity and product page positioning optimised for maximum exposure without disrupting the product image and information.
Adding Taggstar to the NA-KD website was easily done with a simple integration using Google Tag Manager.
“Taggstar has helped us drive conversion and customer engagement by real-time messaging in the product cards.”
Jonathan Johansson, Growth Manager
The Results
NA-KD tracks and measures all its test results through the Taggstar customer dashboard and Google Analytics.
The dashboard tracks all social proof experiments, including conversion rate uplift, revenue and incremental orders attributed to product pages showing Taggstar messages. Results are viewable per experiment, and as an average across all experiments.
To July 2019, NA-KD had completed four social proof A/B tests. Starting with an initial test between September and October 2016, it split site traffic 50:50. This allowed it to compare conversion rate uplift, revenue and orders uplift from customers who saw Taggstar messages with a control group that didn’t.
It was an immediate success. Between September and October 2016, the test showed an uplift in the conversion rate of 3.6% and an increase in revenue directly attributable to Taggstar social proof messaging.
The power of social proof to convert customers was clear. NA-KD was convinced, the software was permanently extended to 100% of site traffic.
NA-KD continued to regularly test Taggstar performance, with three other social proof A/B tests in Feb 2017, April and May 2019.
 Call us
 Contact us